Blog: 2025-11-08: Difference between revisions
Jump to navigation
Jump to search
No edit summary |
No edit summary |
||
| Line 34: | Line 34: | ||
plt.show() |
plt.show() |
||
</pre> |
</pre> |
||
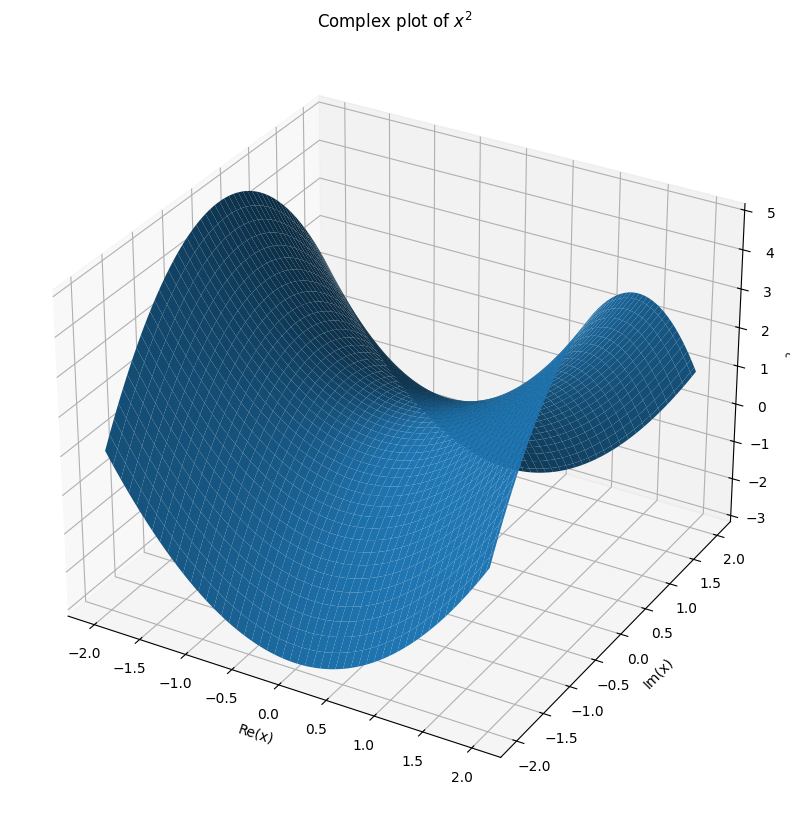
[[File:Complex plot x squared.png|frameless|center]] |
|||
Latest revision as of 16:03, 8 November 2025
This webapp graphs complex functions https://hemisemidemipresent.github.io/complex3/
This gamma function graph shows how you can plot the real and complex parts of a complex-valued function https://en.wikipedia.org/wiki/Gamma_function with the colors
This matplotlib
import matplotlib.pyplot as plt
import numpy as np
from mpl_toolkits.mplot3d import Axes3D

plt.rcParams['text.usetex'] = False

def real(n):
    return n.real


def faux_complex_function(x, y):
    return real((x + 1j * y)**2 + 1)

x = np.linspace(-2, 2, 100)
y = np.linspace(-2, 2, 100)
X, Y = np.meshgrid(x, y)
Z = faux_complex_function(X, Y)

fig = plt.figure(figsize=(12, 10))
ax = fig.add_subplot(111, projection='3d')
surf = ax.plot_surface(X, Y, Z)
ax.set_xlabel('Re(x)')
ax.set_ylabel('Im(x)')
ax.set_zlabel('$x^2$')
ax.set_title('Complex plot of $x^2$')
# plt.colorbar(surf)
plt.show()
